Learn the moves
In this playbook, we present most successful strategies to use in trading with our indicators and data we provide.
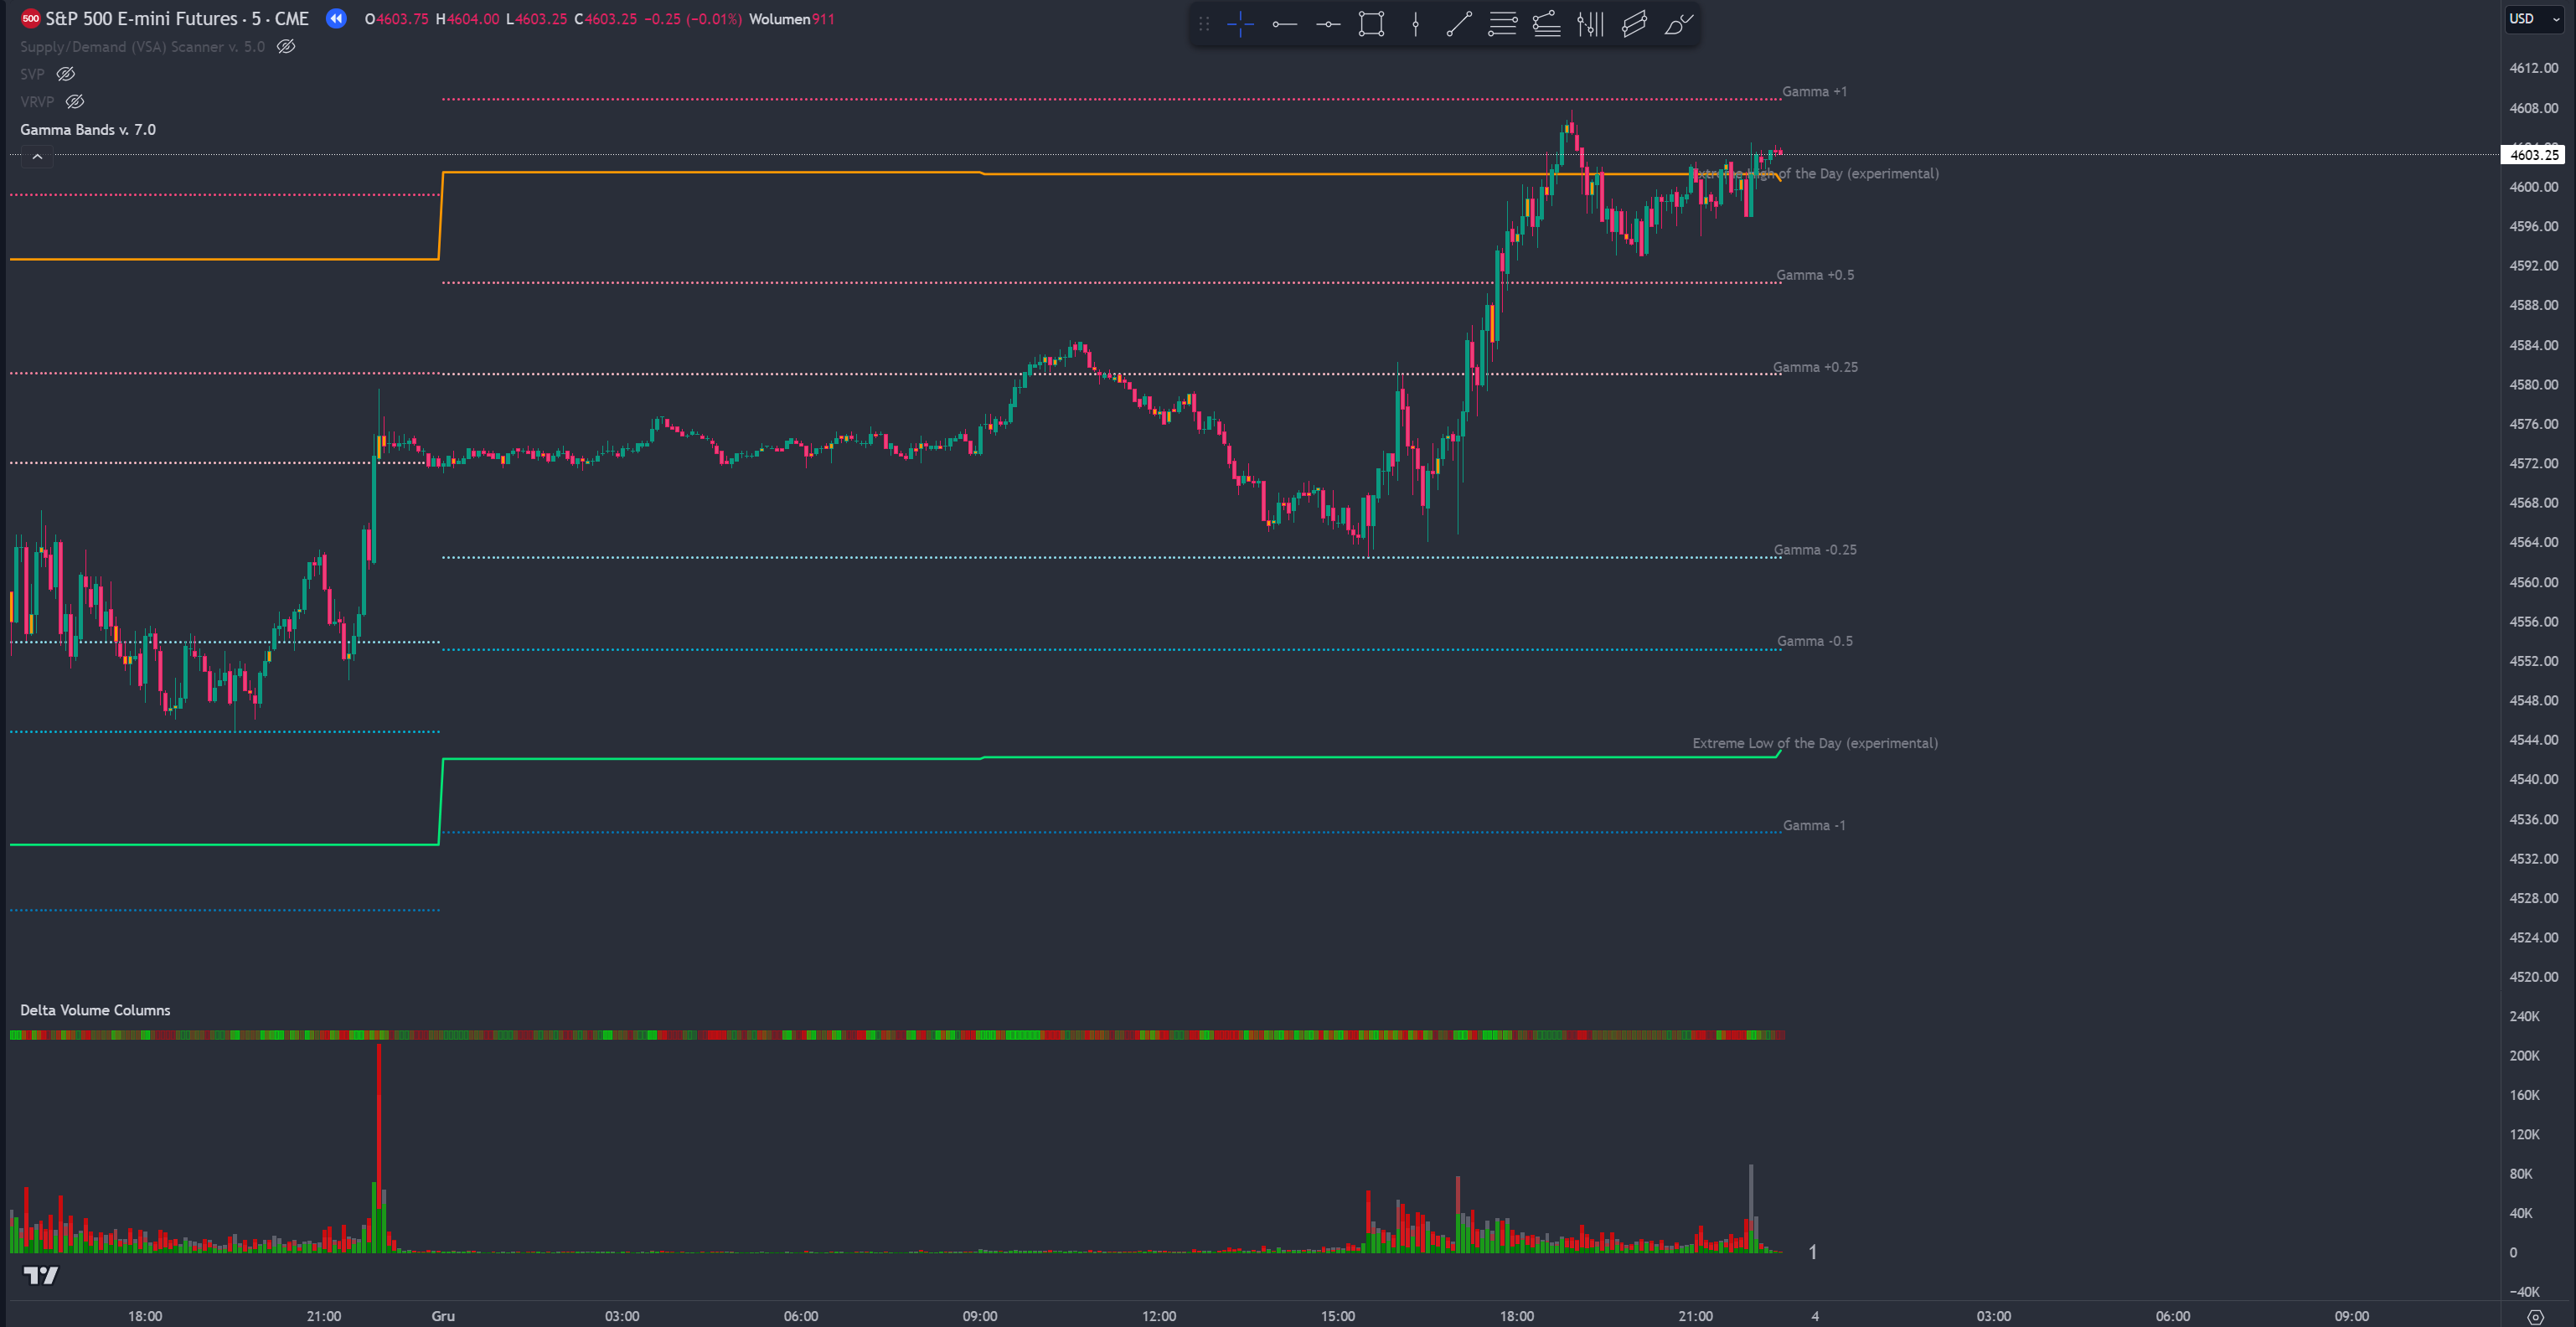
Gamma Levels strengths and precision
The first thing to understand is the "balance zone," which lies between the Gamma +0.25 and Gamma -0.25 levels. This zone represents the fair price for a given day, and personally, I avoid trading within this zone.
As you move further away from the balance zone, the levels become stronger. The extreme levels projected for an Intraday session are marked with Gamma +/- 1 levels.
Extreme High and Low of the Day
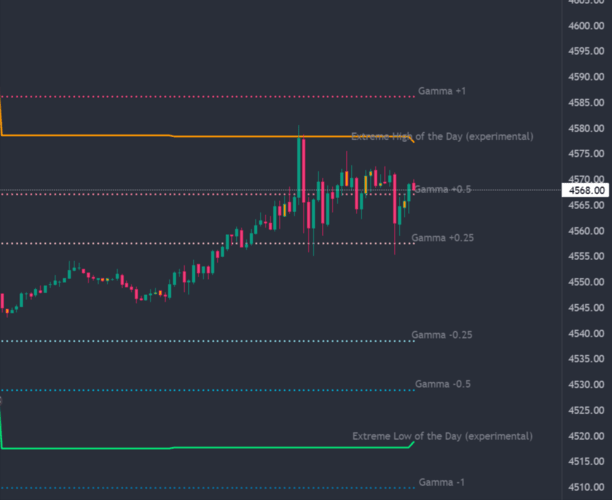
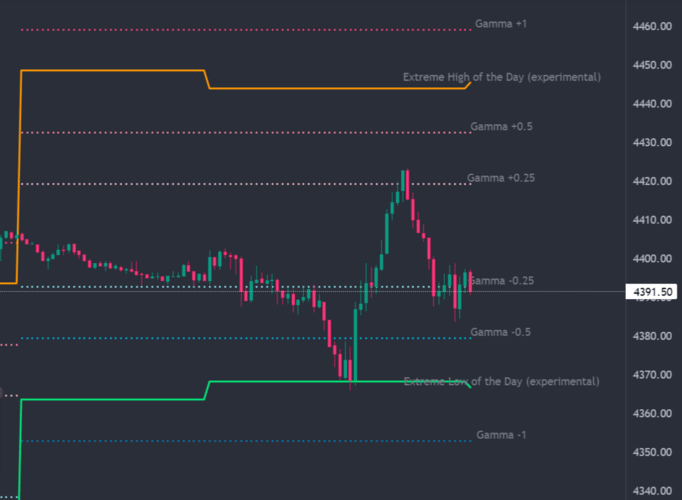
As shown in the screenshots above, the orange and bright green lines play a significant role on the chart. Often, when the price approaches these levels, I set a pending order on them in the direction of a potential price reversal, accompanied by a relatively tight stop loss.
Breaking Gamma -/+ 1
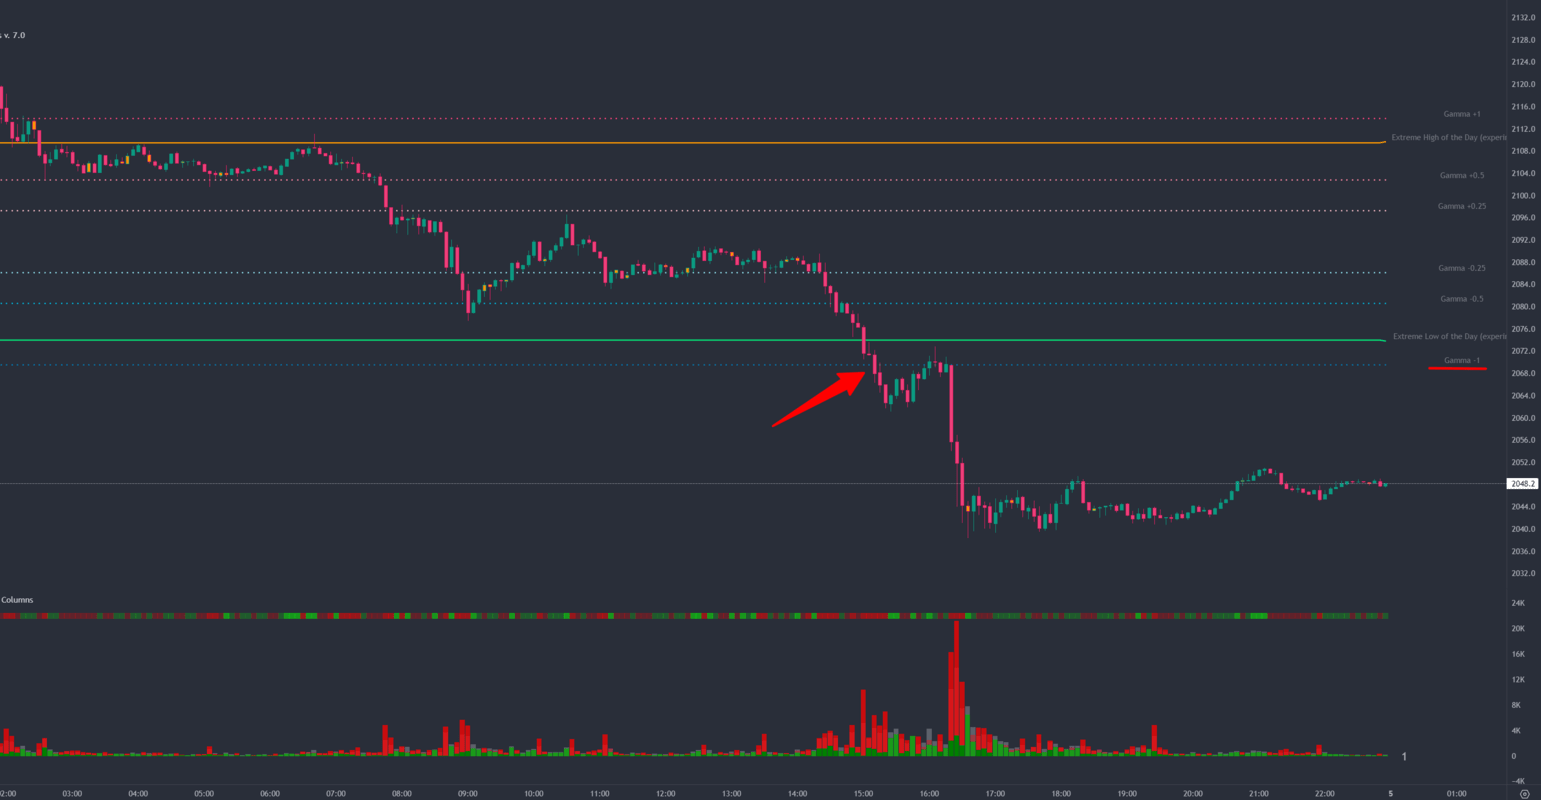
It's not a frequent occurrence, but when the price breaks through the last Gamma levels (either +1 or -1), it tends to continue moving in the direction of the breakthrough for some time. I begin my trading day by setting two pending positions: one for a Buy/Long direction slightly above the Gamma +1 level, and another for a Short/Sell direction slightly below the Gamma -1 level. Often, breaking these last Gamma levels coincides with Trend Days in the market.
I exit such positions (or secure them with a profit by moving Stop Loss levels) using a Supply/Demand Scanner, which effectively identifies reversals and the end of such movements. Another strategy for exiting is to watch for a high spike in volume at the top or bottom, indicating that traders are taking profits.
Reversal from Gamma -/+ 0.5
A common and straightforward trading situation involves reversals from the Gamma 0.5 levels. In about 8 out of 10 cases, the price tends to revert back to the midpoint of the Balance Zone.
Supply and Demand (VSA) Scanner signals
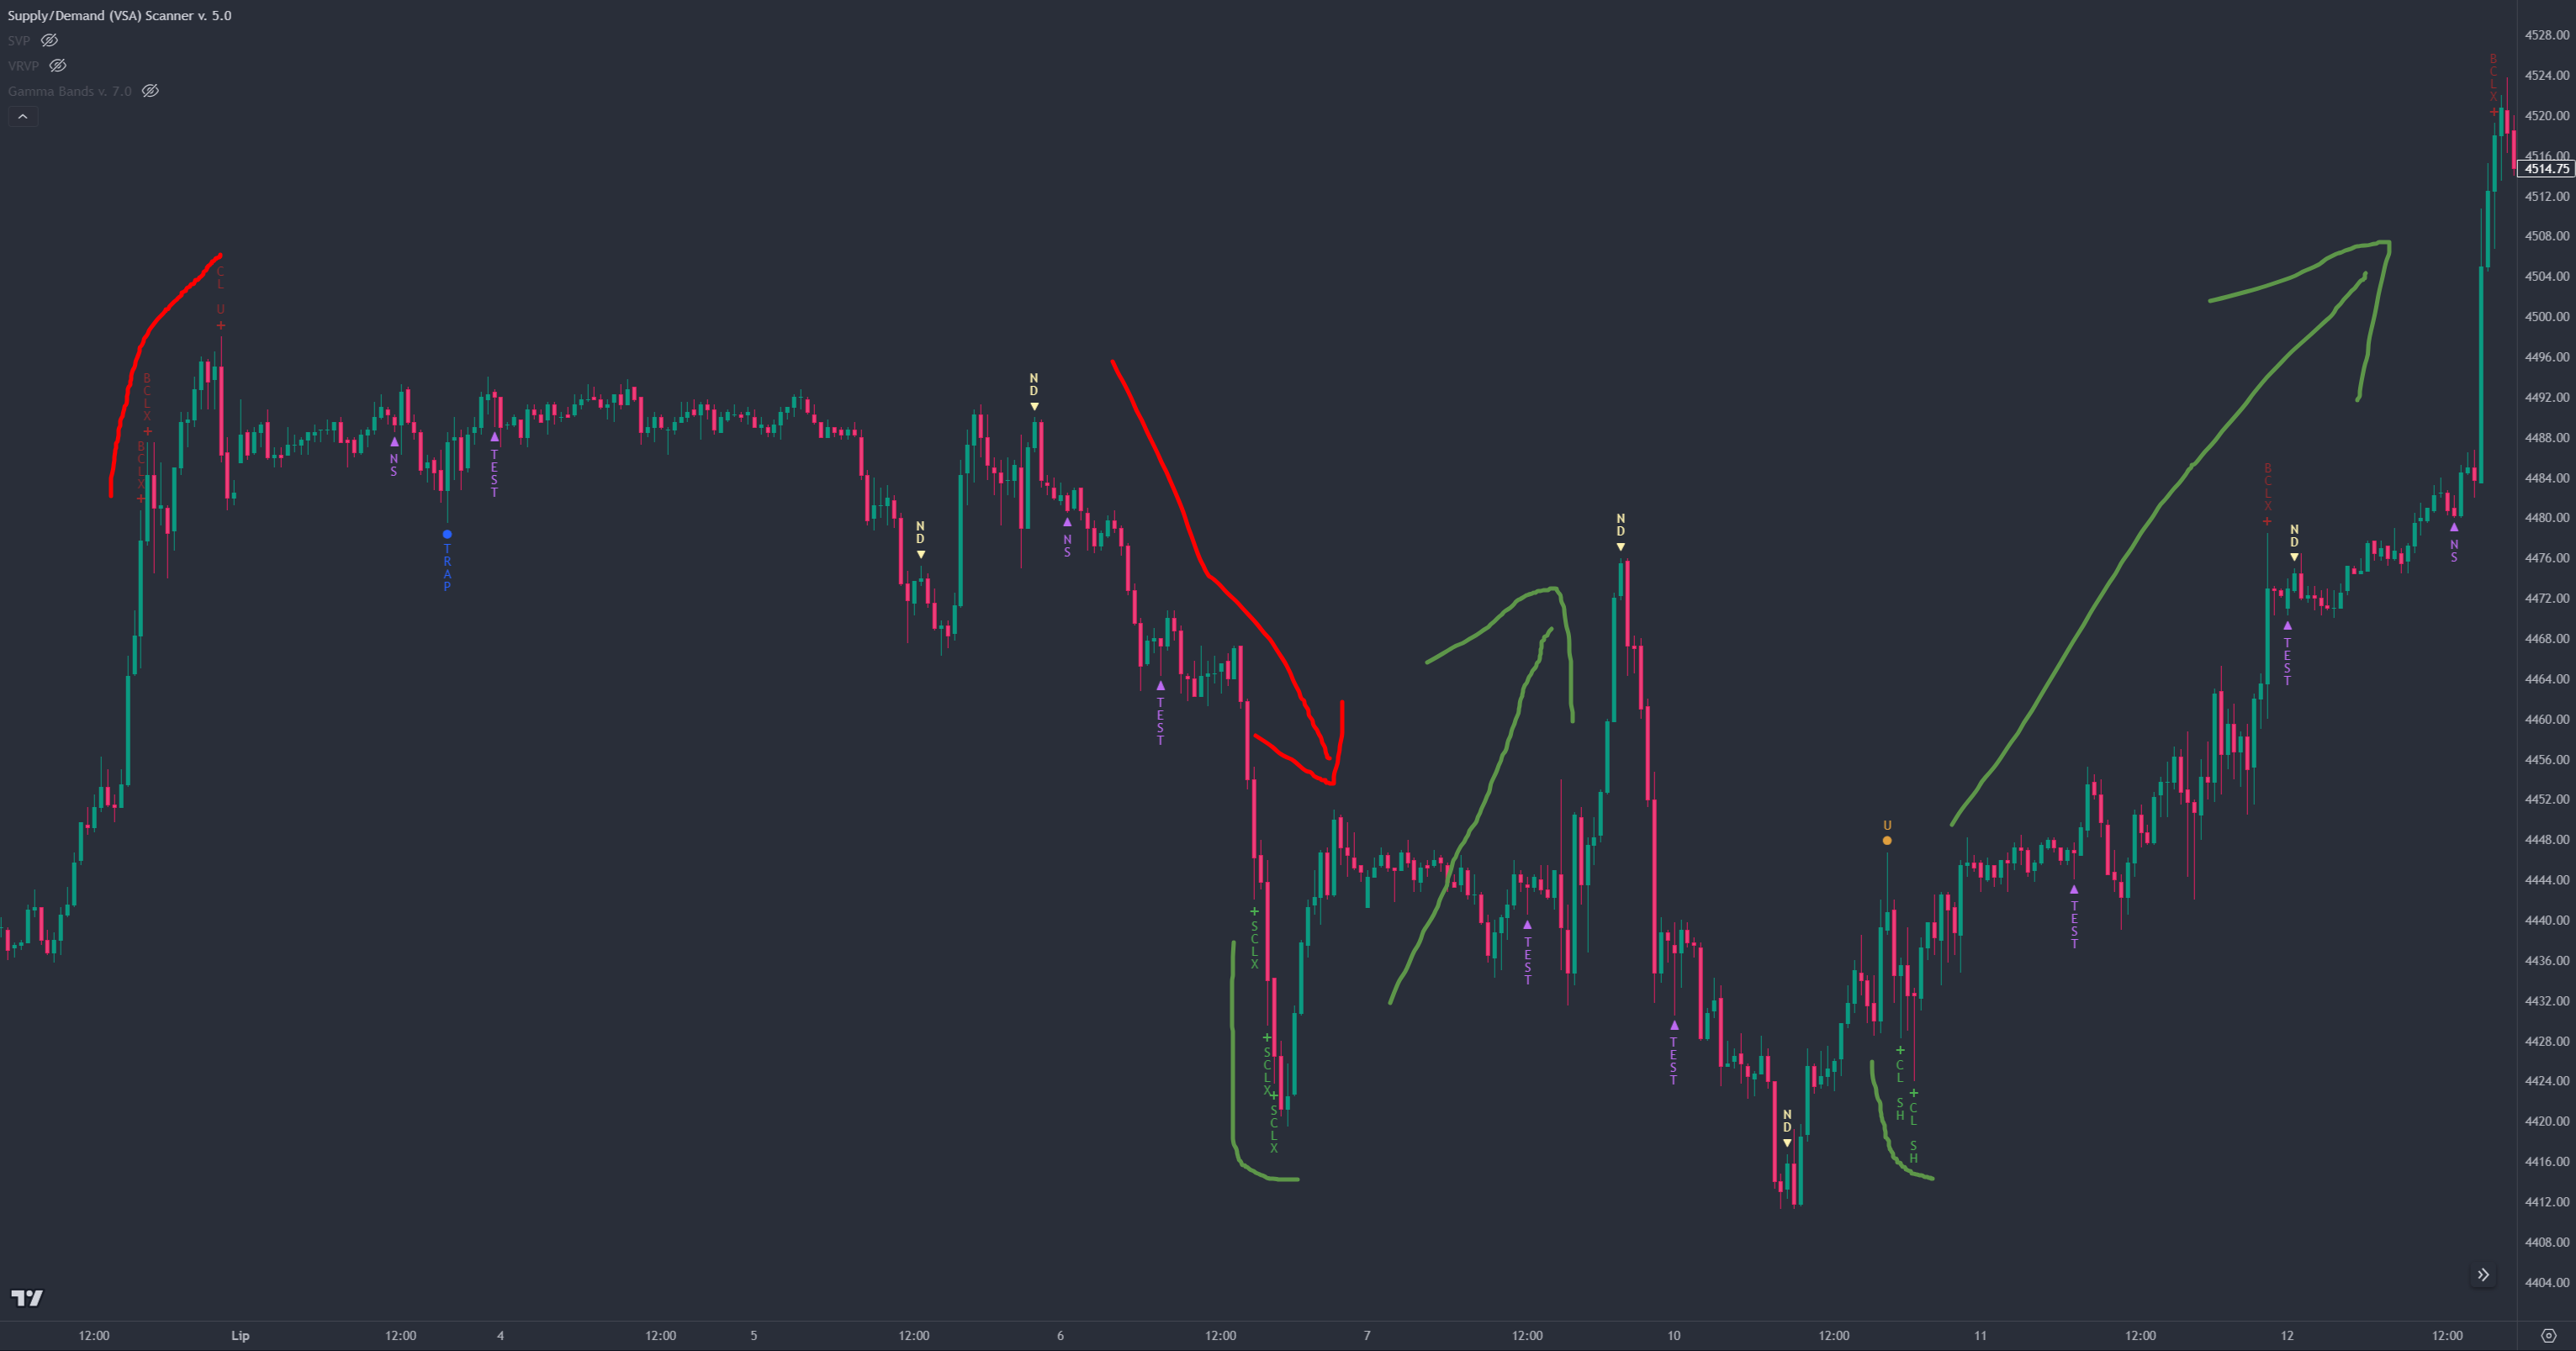
The Supply and Demand Scanner, especially with advanced signal definitions enabled in its settings, is designed to provide early warnings before reversals or breakthroughs occur, allowing us to position our trades accordingly. I personally look for at least two major signals (either green or red) before making a decision.
Orange and blue signals are of secondary importance. I typically look for a combination of either two or more green signals for a buy, two or more red signals for a sell, a red-orange combination for a sell, or a green-blue combination for a buy. I also find it helpful to switch between timeframes and observe the general direction of the trend identified by the Scanner. If I'm trading on the M15 timeframe and looking to take a Long trade, and I also observe a Bullish trend on the M30 and H1 timeframes, my confidence in the trade is significantly higher.